Study Updates
Priorities
Existing Traffic
Historic Safety
Land Use
Historic Development
Study Area Priorities
| Priority | Number of Votes per Rank 1 – most important, 10 – least important |
Dot Vote Results | ||||||||||
| 1 | 2 | 3 | 4 | 5 | 6 | 7 | 8 | 9 | 10 | Sum Lowest Score = Highest Priority |
Rank | |
| Increase Roadway Safety | 72 | 41 | 42 | 18 | 19 | 7 | 5 | 2 | 4 | 1 | 586 | 1 |
| Preservation of Rural Areas, Open Space, & Hilltops | 61 | 44 | 37 | 23 | 19 | 17 | 11 | 8 | 7 | 2 | 773 | 2 |
| Increased Opportunities to Walk & Bike | 23 | 28 | 34 | 31 | 17 | 15 | 14 | 13 | 10 | 7 | 842 | 3 |
| Greater Connectivity to & Across Interstate & Pellissippi Pkwy | 40 | 38 | 24 | 21 | 15 | 25 | 15 | 8 | 12 | 7 | 844 | 4 |
| Development Options that Require Less Driving | 4 | 12 | 14 | 23 | 21 | 24 | 20 | 17 | 18 | 4 | 889 | 5 |
| Homes on Large Lots | 11 | 25 | 23 | 22 | 18 | 18 | 10 | 22 | 21 | 14 | 991 | 6 |
| Access to Jobs, Shopping, and Schools | 15 | 19 | 21 | 28 | 34 | 19 | 35 | 11 | 11 | 12 | 1,064 | 7 |
| Diverse Housing Options | 1 | 4 | 5 | 10 | 16 | 22 | 24 | 26 | 28 | 34 | 1,244 | 8 |
| Grow in Undeveloped Areas | 4 | 4 | 4 | 5 | 9 | 15 | 13 | 25 | 32 | 52 | 1,278 | 9 |
| Reduce Greenhouse Gas Emissions | 4 | 10 | 9 | 20 | 13 | 19 | 15 | 25 | 19 | 57 | 1,356 | 10 |
| Corridor 1 ‐ N. Campbell Station Road | |
| Improvement Type | Percent of Total Dot Votes for Corridor |
| Safety | 28.0% |
| Congestion Mitigation | 27.1% |
| Roundabout | 14.8% |
| Access & Connectivity | 11.2% |
| Traffic Signal | 8.8% |
| Bicycle | 6.4% |
| Pedestrian | 3.7% |
| Total Percentage | 100.0% |
| Corridor 2 ‐ Yarnell Road | |
| Improvement Type | Percent of Total Dot Votes for Corridor |
| Safety | 27.1% |
| Roundabout | 19.1% |
| Access & Connectivity | 17.0% |
| Congestion Mitigation | 16.6% |
| Bicycle | 10.5% |
| Traffic Signal | 5.3% |
| Pedestrian | 4.4% |
| Total Percentage | 100.0% |
| Corridor 3 ‐ Solway Road | |
| Improvement Type | Percent of Total Dot Votes for Corridor |
| Congestion Mitigation | 28.4% |
| Safety | 25.6% |
| Access & Connectivity | 22.5% |
| Bicycle | 8.1% |
| Traffic Signal | 6.6% |
| Pedestrian | 4.8% |
| Roundabout | 4.0% |
| Total Percentage | 100.0% |
| All Corridors ‐ Total | |
| Improvement Type | Percent of Total Dot Votes for All Corridors |
| Congestion Mitigation | 27.3% |
| Safety | 25.9% |
| Access & Connectivity | 17.1% |
| Roundabout | 9.7% |
| Bicycle | 9.4% |
| Traffic Signal | 5.9% |
| Pedestrian | 4.7% |
| Total Percentage | 100.0% |
Existing Traffic
Traffic volumes were collected at 27 major intersections within the Hardin Valley community to assist in analyzing peak hour congestion levels as well as understanding the complex travel patterns within the study area.
As expected, the data showed that the highest peak hour volumes were experienced at intersections along, or in close proximity to, Pellissippi Parkway.
Using the map below: Zoom into a particular intersection to view the peak AM and PM traffic counts. Click/tap an intersection for more details.
The AM and PM peak period counts represent the one-hour period of time in the morning and afternoon with the highest total traffic volume entering each particular intersection. The traffic was observed and counted by each movement (left, right, straight through) at the study intersections for a minimum of two hours in each period and tallied in 15-minute intervals with four highest consecutive intervals comprising the peak hour. This data was then used to determine the capacity and level-of-service at each intersection to evaluate its performance with regard to delay and congestion.
View Full Map (PDF)
Historic Safety
Historic crash data was analyzed for a 3-year period (January 2015-January 2018) in the Hardin Valley community.
Creating a heat map of these crashes showed that the interchanges along Pellissippi Parkway experienced the most crashes in this time frame.
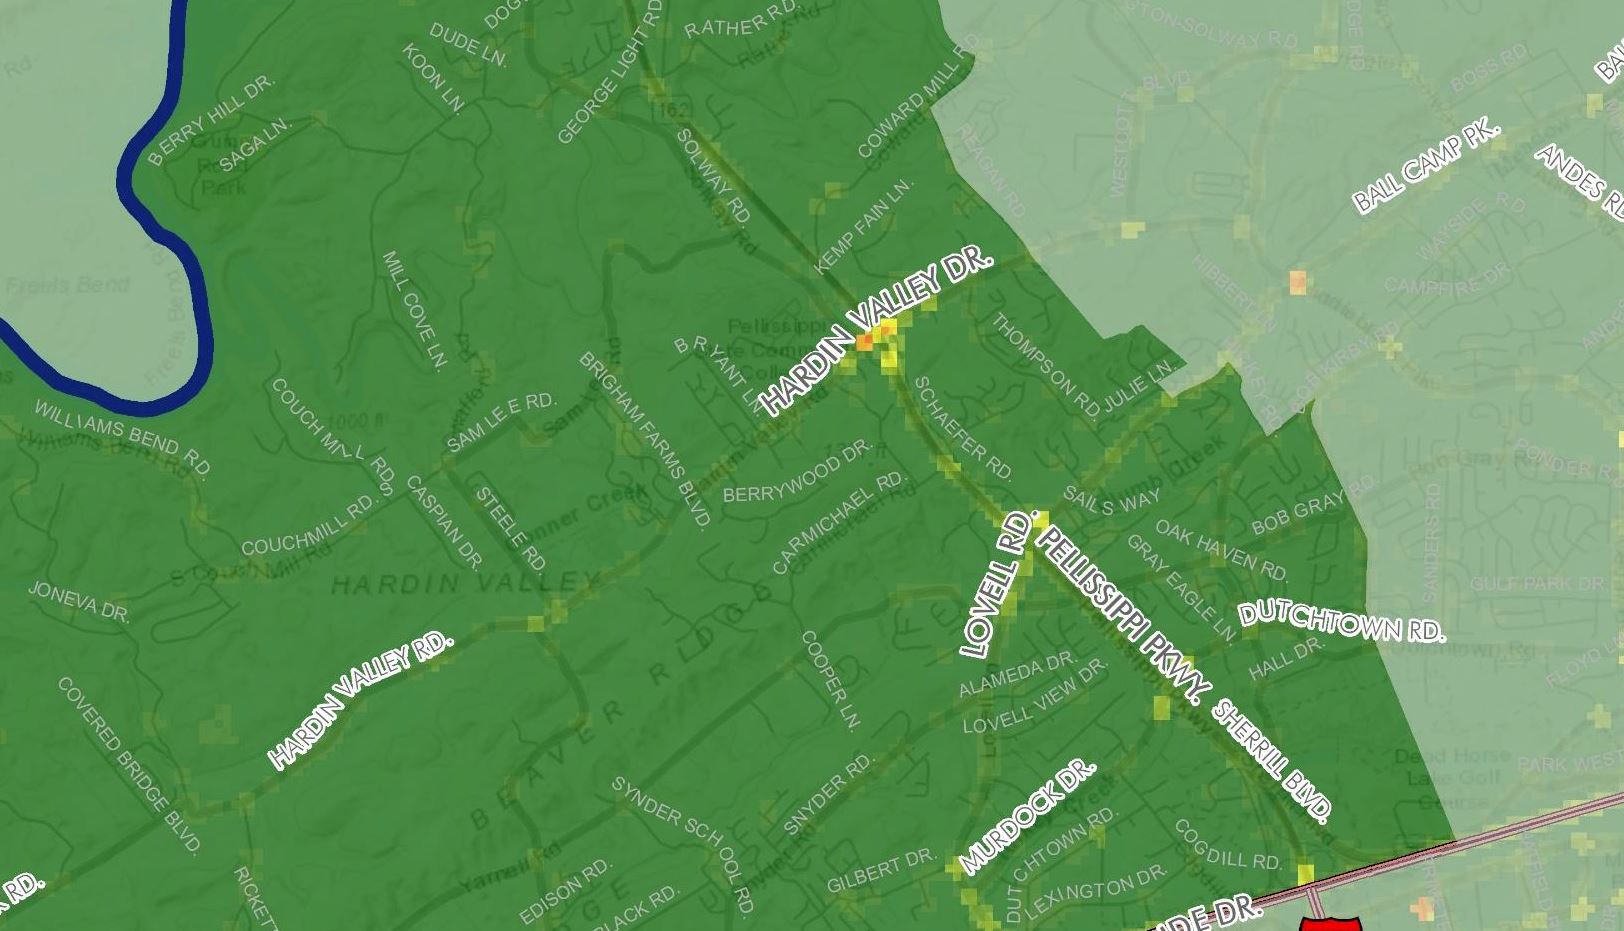 View Full Map (PDF)
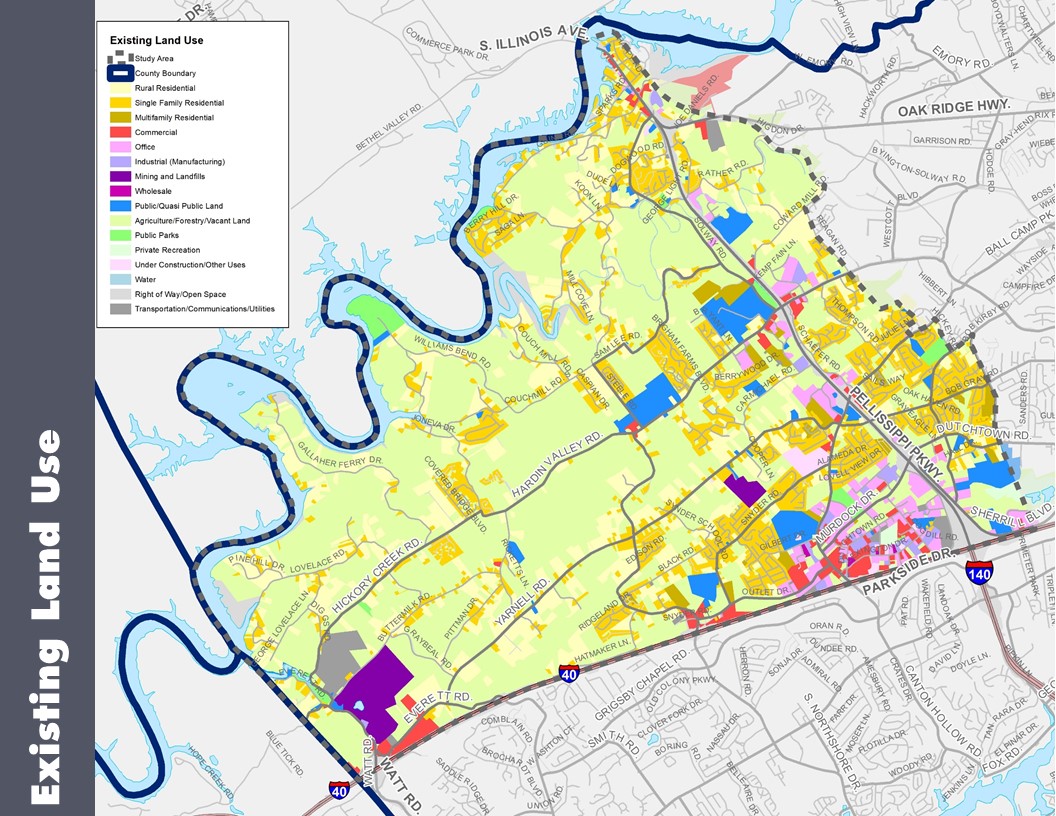
Land Use
The existing land uses within the Hardin Valley study area are dominated by Agriculture/Forestry/Vacant Land, followed by Rural Residential and Single-Family Residential uses.
Commercial, Office, and Multifamily Residential uses are largely clustered near Pellissippi Parkway and I-40/75 interchanges.
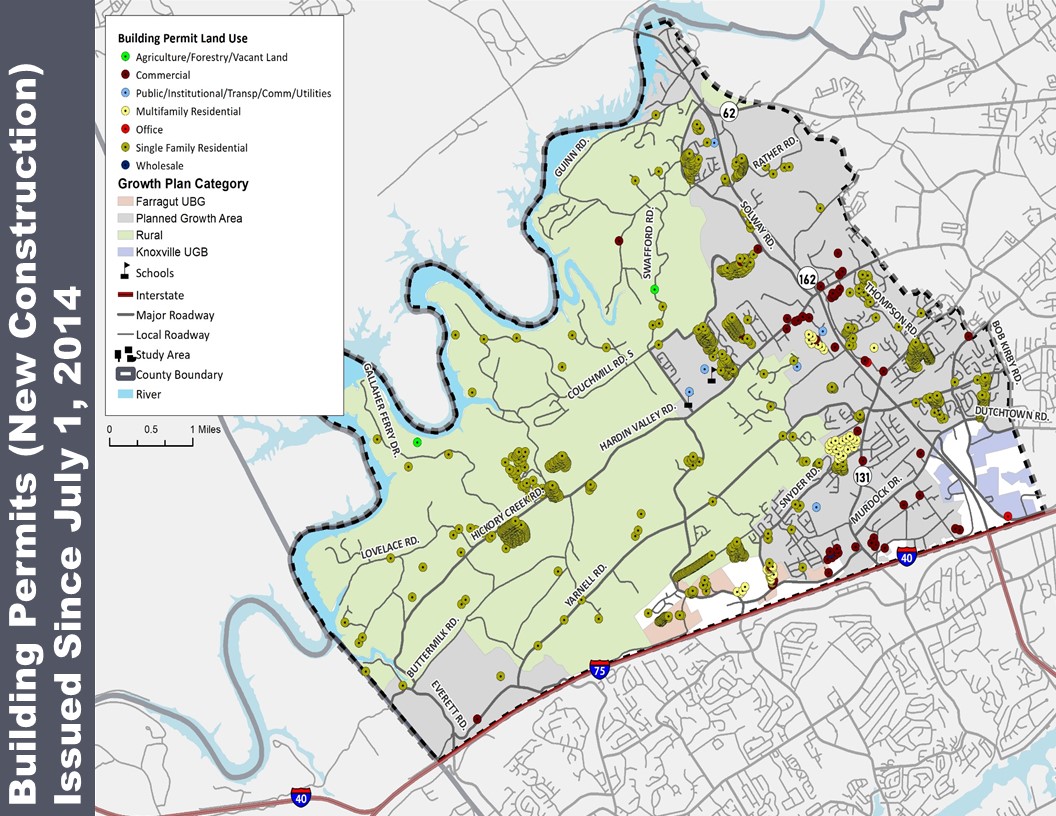
Historic Development
Between July 2014 and July 2018, approximately 1,200 building permits were issued for new construction projects within the Hardin Valley study area.
Roughly 90% were for residential uses and the remaining 10% being all other uses.
About the Study
The project focused on identifying existing and future transportation facility deficiencies. Transportation improvements that were identified in past studies were prioritized, and improvements to the road network that address safety, congestion and connections across the area were recommended. Preliminary cost estimates for 5, 10 and 20-year horizons were given. Because the study focused on travel within Hardin Valley, as well as the major roadways leading to and from it, the study covered a larger area.
There are significant topographical constraints in the study area that create mobility and connectivity challenges.
Project Schedule
The project began in the summer of 2018 and was completed in the fall of 2019. Data collection activities, such as traffic counts, began in the fall of 2018, when school was in session.
Contact Us
If you would like to discuss the study or have questions, contact us below.